
On May 21st, we launched Insights, an AI-powered suite of products that delivers real-time visibility into your entire customer experience. As part of Insights, we built ‘Suggestions’ to tackle help improve knowledge center documentation and Fin’s performance.
Fin relies on retrieval-augmented generation (RAG) to answer questions, so the quality of its responses depends on the quality of your content. While the AI Group has invested heavily in making both the retrieval and the generations better, we also needed to help improve documentation. Suggestions uses LLMs to generate targeted, pre-written updates, and delivers them in a simple UI so you can review, accept, or edit changes with a single click.
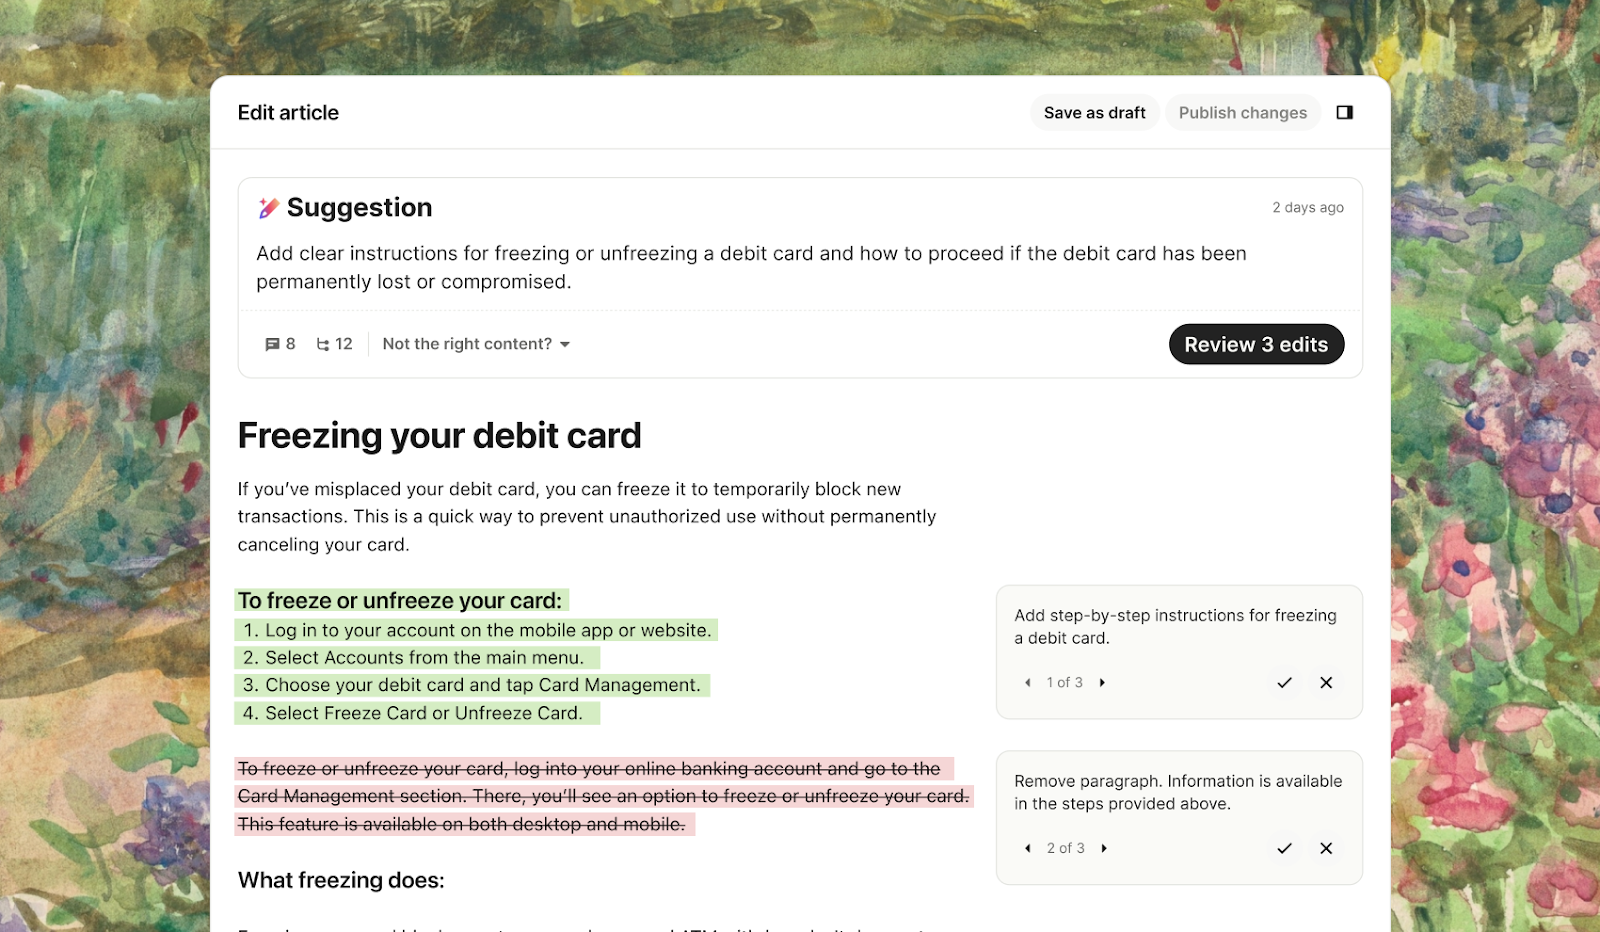
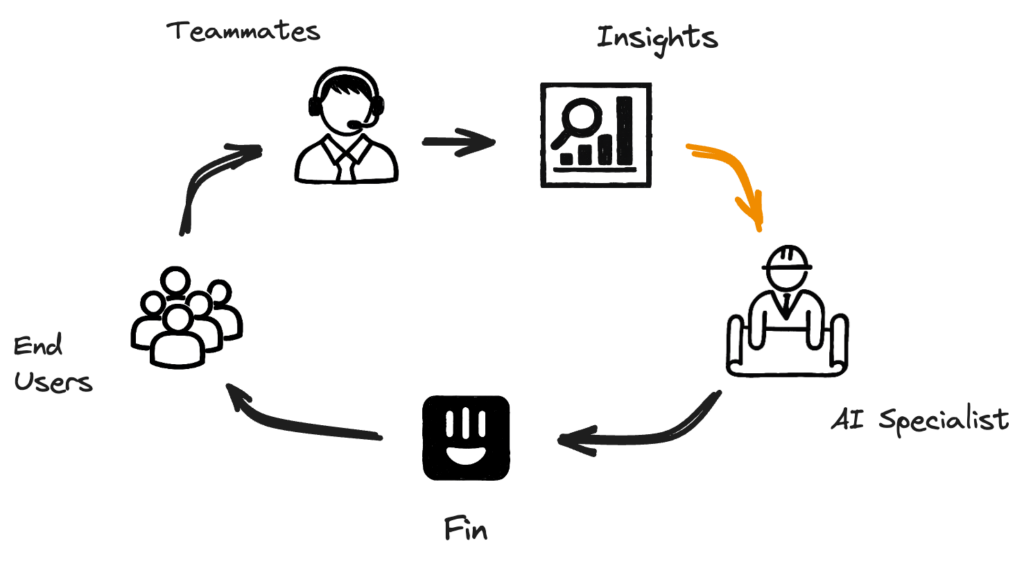
To generate these Suggestions we analyse all your unresolved conversations to recommend ‘Edit Suggestion’ or question-answer ‘Snippets’ based on how human agents handled these cases. This creates a self-improving loop, helping to enhance both the knowledge base and Fin’s resolution rate while giving more control and support to AI Specialists maintaining them.
You can find out more about its inner workings on our blog post on how we built the product.
Measuring the Impact of Suggestions
The question is: once suggestions get approved, how do we measure whether this has increased the resolution rate? Practitioners will naturally turn to A/B testing first: this is the gold standard to infer causality after all. But in our context, it is difficult and complex to run: on the one hand we would need to maintain a holdout version of their Knowledge Centre that would be able to accept critical updates while holding back Suggestions; on the other hand we would need customers to agree to run an A/B test that could be costly for them because of the additional volume going to their support team while it runs.
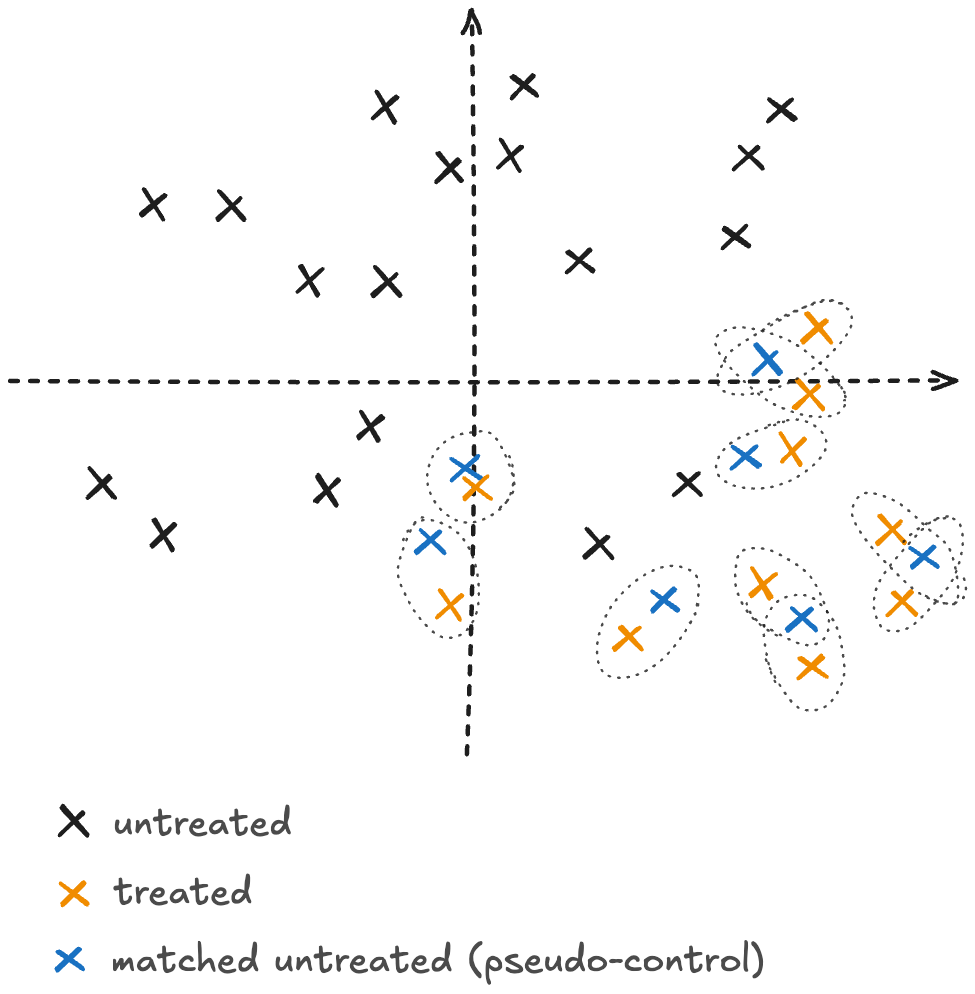
As an alternative, we decided to analyse conversations after the fact by applying causal inference techniques which reduces bias from potential confounding factors. We split conversations into those influenced by Suggestions (treated) and those that weren’t (untreated). By applying a matching method to find pairs of semantically similar conversations, we created a comparable ‘pseudo-control’ group from the untreated conversations, enabling us to estimate an unbiased effect of Suggestions. Our analysis showed that within the first month since launch using Suggestions resulted in an average increase of 1.23 percentage points in Fin’s resolution rate across active customers, with some achieving gains as high as 10.
Treated and Untreated Conversation Data
To measure the resolution impact using causal inference, let’s first define what the treatment set is: conversations where Fin used at least one impacted piece of content to answer a question. In most cases, these will be articles with a recent ‘Edit Suggestion’ or a recently approved ‘Snippet’ (a small question-answer piece of content that is not visible in the Knowledge Centre but can be used by Fin to answer specific questions.)
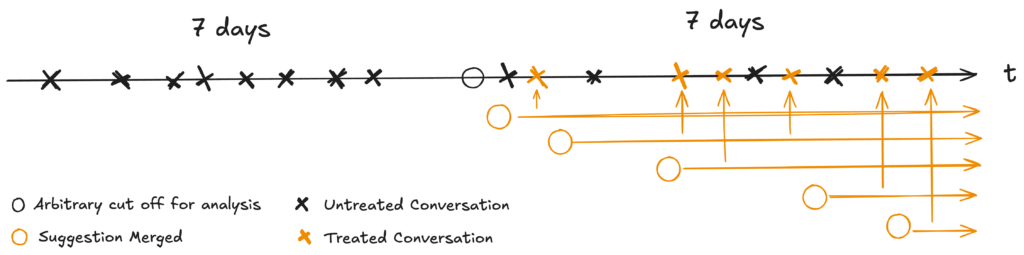
To create the treatment dataset, we define an arbitrary starting point in time, and collect conversations in a window between N days before and after (e.g. a week or a month). After the starting point, we keep track of all the suggestions merged during that period. All Fin answers that use documents impacted by at least one of these suggestions are assigned to the treatment set, as illustrated in the drawing. The reason we want to look for a week before will become clear once we describe our matching methodology – but in brief, we want to increase the chances of finding a good quality match for each treated conversation in case a customer approves a lot of suggestions and ends up impacting all their traffic.
Inferring a Causal Effect
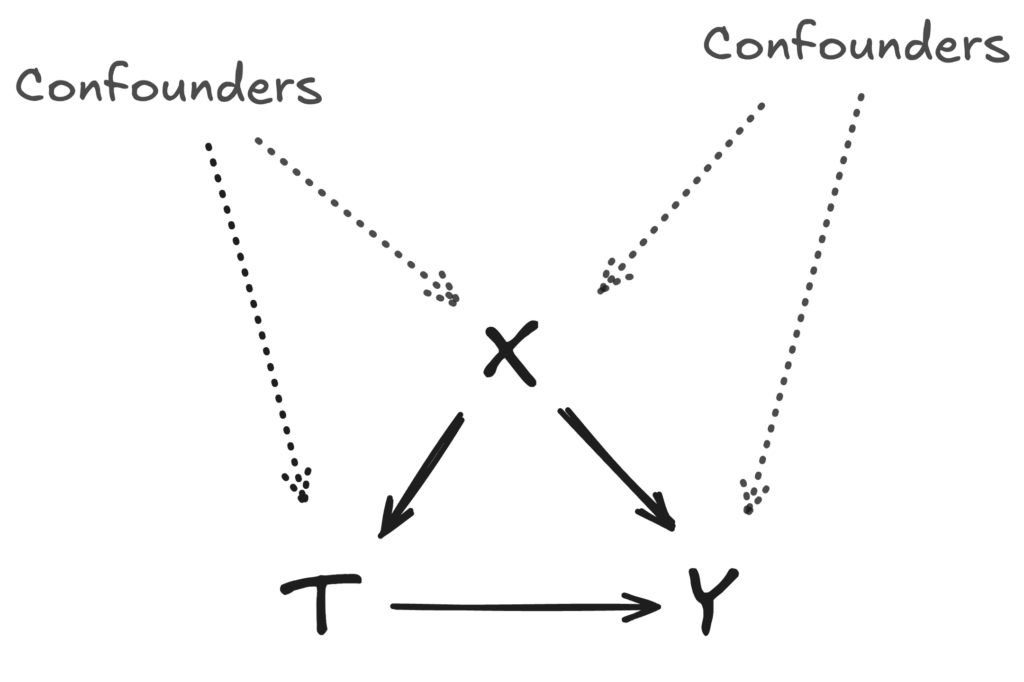
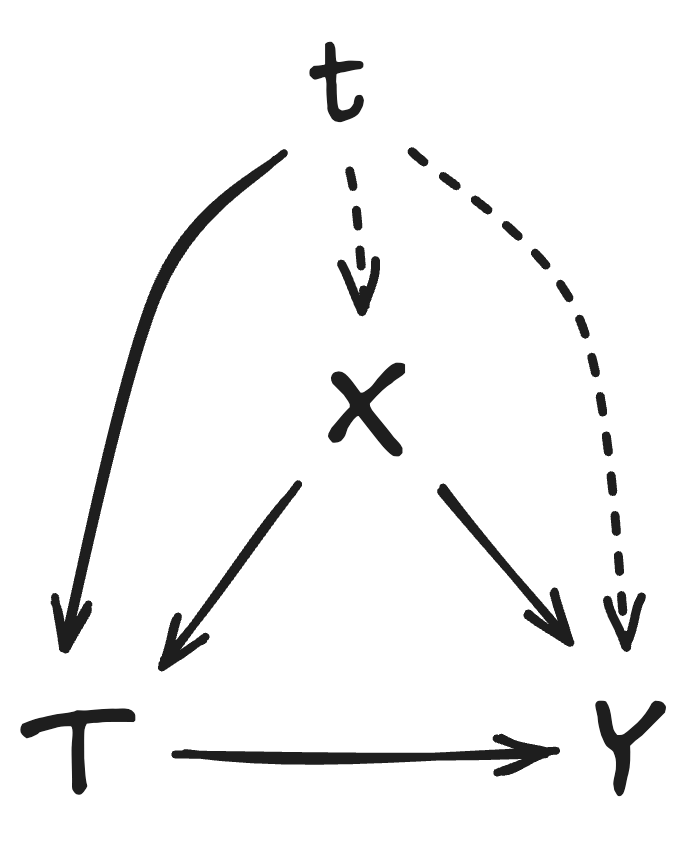
When treatment can’t be randomised as in an A/B test, one cannot just compare the resolution rates of treated and untreated samples. In general, inferring causality requires two key ingredients: (1) ensuring the direction of the causal relationship between the treatment \( T \) and the dependent variable \( Y \) (resolution rate in our case); (2) accounting for confounders that influence both treatment assignment and the outcome. In our case, we do not have to worry about the direction because the treatment is always assigned before the resolution. Hence our focus is on removing the potential confounding bias by finding a good set of covariates that would act as a proxy for potential confounders.
In most causal inference use cases, there may be a plethora of confounders. In practice, it is often impossible to observe all of them, so we aim to identify variables that, either as true confounders or as proxies, capture most of the confounding effect. By conditioning on this set of variables \( X \), we assume that the treatment assignment \( T \) is independent of the potential outcomes \( (Y_0, Y_1) \) given \( X \) or \( (Y_0, Y_1) {\perp\!\!\!\perp} T | X \). Under this crucial assumption, and given that treatment precedes the outcome, we can estimate the causal impact of \( T \) on \( Y \) by comparing mean outcomes between the treated and matched control groups.
Using Question Summaries as Proxy
So what could be a good variable to capture confounding? In the case of resolutions, a big role is played by the nature of the end user questions. Some questions are more meaningful or relevant than others; some questions have better content available in the knowledge base; AI Specialists prioritise topics considered more critical, etc.
We posit that using the ‘subject’ or ‘topic’ of these questions is likely the best way to account for most confounding factors. The main assumption is that similar conversations will share a lot of peculiarities that would impact both resolution rate and whether a suggestion has been generated by the system and approved by the specialist.
The good news is that we have access to summaries of user questions that Fin generates before answering. By embedding these summaries with a sentence transformer and measuring their cosine similarity, we can effectively match similar conversations.
Matching Treated and Untreated Conversations
‘Matching’ is a widely used method in causal inference (see references.) The basic idea is very simple, because of the confounding factors, we cannot compare the resolution rates of the treated and untreated conversation sets, simply because the treatment assignment is not neutral making the two sets not consistent. In other words, suggestions might impact a narrow group of questions, making the treatment set much more ‘specific’ than control.
The way to get around this problem is by ‘matching’ (with replacement) each treated conversation with an untreated one maximising a similarity function on the covariate \( X \) that we want to condition on. This effectively creates a pseudo-control group with similar covariate distributions which makes it comparable to the treatment set. This allows for causal comparisons under the assumption that confounders have been accounted for in the matching process. By matching on the relevant covariates, we are, in effect, simulating what would happen if treatment were assigned randomly within groups defined by \( X \) , thereby approximating the conditional independence assumption \( (Y_0, Y_1) {\perp\!\!\!\perp} T | X \) that underpins valid causal inference.
As mentioned above, there is a natural way for us to match conversations:
- Use concatenated question summaries (from one or more questions the end user asked Fin)
- Embed them using a sentence transformer (eg.
all-MiniLM-L6-v2) - Use cosine similarity to find the most similar untreated conversation for each treated conversation with replacement.
- Finally, we prune pairs that are a very poor match (less than 0.5 cosine similarity); this risks loss of generality but will make the system more robust in edge cases, making it safer to run at scale.
Here are some examples with various levels of similarity (a conversation might contain more than one question):
| Treated | Matched | Similarity |
| How do I cancel my subscription? | How can I cancel my subscription? | 0.996 |
| How can I resolve the “403 Forbidden: Workspace Suspended” error when trying to verify my email address on Intercom? | Why is my new Intercom account showing “Workspace Suspended” with a 403 Forbidden error immediately after I created it and tried to verify my email address?; | 0.9164 |
| Why is automatic email forwarding failing to verify and how can I resolve this issue? | Why is my email verification failing when I try to set up automatic forwarding for my email? | 0.891 |
| … | ||
| Does the Intercom phone need to be in a specific inbox tab or can it be in the “Your Inbox” tab to receive inbound calls?; Does the Inbox tab that needs to be open for inbound Intercom phone calls to pop up have to be a specific Inbox, or will the “Your Inbox” tab also work?; | Why am I not receiving call notifications or transfers even after checking my availability, browser settings, and keeping the Inbox open?; Why am I not receiving notifications for incoming calls or direct call transfers?; | 0.705 |
| How can I stop forwarding emails from Gmail to Intercom?; How can I disconnect my Gmail account from Intercom?; Where can I find the option in Intercom to disable or turn off automatic email forwarding from Gmail?; | How can I block the Gmail domain in Intercom?; | 0.705 |
| … | ||
| If a customer replies during a 5-day wait time action in workflows, will the flow end, continue to the next step, or behave differently?; | If I update a ‘customer has been unresponsive’ workflow to extend the timer while it’s live, will the change apply to conversations already running the workflow or only to new conversations going forward? | 0.584 |
| What is the issue with the URL I provided for app? | How can I set up a webhook for my new app if it’s not working? | 0.560 |
Average Treatment Effect on the Treated
It is now a good time to address what we are measuring. As a reminder, our objective is to give the following information to our customer: “What was actually the impact of accepting suggestions on the resolution rate?” To answer such a question, the Average Treatment Effect on the Treated (ATET) is the most pertinent metric. In other words, the impact on the treated set, what has actually been influenced by suggestions.
$$ATET = E[Y_1 – Y_0 \mid T = 1]$$
Measuring the ATET is quite simple once the matching is done: we just look at the difference between the resolution rate of the pseudo-control and the treatment. Formally:
$$\widehat{ATET} = \frac{\sum_{i: T_i=1} y_i \, – \, y_{m(i)}}{\sum_i T_i}$$
Where \( m(i) \) is the index returned by the matching function \( m \). To measure business impact, we scale the ATET by the share of treated conversations to show the overall increase in resolution rate. For example, a 10% ATET with 10% of conversations treated results in a 1% overall boost on the Resolution rate, which is more material for business decision making.
Debiasing Matching Errors and Addressing Time Effects
Matching Error bias
In practice, it is impossible to achieve perfect matching. While some units may find exact matches (e.g., questions with identical summaries), most matches will be semantically similar but non-identical. This imperfect matching introduces matching error bias: as the quality of matches deteriorates (that is, as differences between matched units increase), the resulting bias in causal effect estimates could grow substantially, see Abatie (2011).
Imperfect matching is a well-known limitation—some bias is almost always present, but it becomes problematic if matching quality is poor or matching error accumulates rapidly. This explains why we keep N days of conversations before the starting point of the analysis: we want to avoid cases where the suggestions impact an overwhelming proportion of conversations, shrinking the pool of untreated questions and impacting the average matching quality. Nevertheless, this is something we should address to increase the quality of the analysis.
Time-bias
Until now, we have ignored temporal effects. However, our experimental design is vulnerable to time-related confounding. Specifically, the likelihood of receiving the treatment \( T \) is positively correlated with time \( t \): as time progresses and more suggestions are approved, more requests are affected.
The main concern is that the resolution rate \( Y \) could also be influenced by time-varying factors such as model deployments, new features, or infrastructure improvements, etc. If these improvements tend to occur more recently and also improve resolution rates, then time acts as a confounder: it is associated with both treatment assignment and the outcome, potentially biasing our estimates upward.
Pragmatically, we chose not to include time in our matching similarity function because doing so would introduce an additional hyperparameter (balancing the weight of time versus semantic similarity). While semantic similarity is broadly applicable across customers, tuning a time-weight hyperparameter would require company-specific calibration and could substantially worsen matching quality if mis-specified. However, time bias is still something we will need to account for.
Debiasing
To address potential bias due to time and some poor matching quality, we can adjust the observed differences between treated units and their matched controls by estimating what their outcomes would have been had both not received the treatment, see Abatie (2011) for details.
The procedure is as follows:
- We train a classifier (e.g., logistic regression) on the subset of untreated data to predict the probability of resolution as a function of observed covariates X and time t (one-hot encoded day): $$E[Y|X,t,T=0]$$
- For each treated unit \( i \) and its matched (pseudo-control) unit \( m(i) \), we use this model to estimate their expected outcome had they not received the treatment: $$Bias_i= E[Y|x_i,t_i, T=0]-E[Y|x_{m(i)},t_{m(i)}, T=0]$$
- This difference captures residual expected outcome differences due to time and sentence embeddings not addressed by the matching process. Intuitively, if there is a bump in resolution rate this will be captured by the variables \( T \).
- The estimate for the treatment effect can be effectively “de-biased” by subtracting this quantity from the observed difference in outcomes:
$$\widehat{ATET} = \frac{\sum_{i: T_i=1} y_i \, – \, y_{m(i)} \, – \, Bias_i}{\sum_i T_i}$$
This approach adjusts for any systematic differences: such as changes between days—that the matching did not balance but which can be predicted using untreated data.
Results so far
We have run the analysis on a sample of around 1000 customers that have approved suggestions, and the results are clear: adding suggestions can help you increase your resolution rate. We have run the analysis of the first month of usage, taking a month before and after the launch date. The weighted average (per customer size) shows an increase of 1.23 percentage point.
Analysing our most active customers (see Table bellow for top 10) we have noticed the following:
- Suggestions tend to focus on high traffic questions. Approving them can have a far reaching impact. Some customers managed to impact up to 76% of their Fin involved conversations by approving as little as 8 suggestions.
- The more you approve, the more impact you have with a correlation of 0.22 between total approved and Resolution Rate impact. Although, sometimes 1 or 2 well targeted suggestions can fill a critical gap and have a major impact.
- Although the tool can lead to significant improvements early on, our system runs constantly and will always find fresh improvements as long as customer representatives need to resolve end user issues.
- Most customers have at least one approval per week. Showing repeated usage with time.
Top 10 most active in terms of number of conversations impacted by suggestions:
| Company | Estimated Resolution Rate Impact | Effect on treated set | Fin Convos | Convos in Treatment | % Impacted | Snippet Created | Edits Approved |
| 1.61% | 9.87% | 76765 | 24773 | 32.27% | 7 | 21 | |
| 0.59% | 2.39% | 30868 | 15872 | 51.42% | 1 | 6 | |
| 1.23% | 9.71% | 50358 | 12669 | 25.16% | 2 | 7 | |
| 2.65% | 9.79% | 43747 | 10857 | 24.82% | 10 | 11 | |
| 4.59% | 10.49% | 13736 | 10440 | 76.00% | 1 | 7 | |
| Intercom | 0.50% | 4.62% | 46663 | 7742 | 16.59% | 0 | 9 |
| 2.33% | 13.32% | 23808 | 7336 | 30.81% | 1 | 18 | |
| -0.04% | -0.17% | 36560 | 6222 | 17.02% | 1 | 10 | |
| 3.00% | 10.56% | 12342 | 6065 | 49.14% | 34 | 36 | |
| 2.04% | 8.01% | 11206 | 5891 | 52.57% | 9 | 22 |
Conclusion
This analysis clearly shows that Suggestions create measurable, meaningful gains in resolution rates for our customers. By applying robust causal inference methods to real-world data, we’ve demonstrated that Suggestions don’t just close the feedback loop; Suggestions actively drive continuous improvement in both Fin’s accuracy and customer support outcomes.
With Suggestions, AI Specialists finally have a scalable way to improve Fin, spot knowledge gaps, and deliver better answers. The results speak for themselves: approving Suggestions leads to higher resolution rates, and those who adopt them widely see the greatest benefits.
This is just the beginning. As we keep refining Suggestions, expect more powerful features: surfacing duplicates, highlighting contradictions, and even recommending database read actions that will make Fin’s answers more personalised than ever. Stay tuned! Your smartest AI support experience is always getting smarter.
References
Abadie, A., & Imbens, G. W. (2011). Bias-corrected matching estimators for average treatment effects. Journal of Business & Economic Statistics, 29(1), 1-11. https://doi.org/10.1198/jbes.2009.07333
For an intuitive introduction we recommend:
Facure, M. (2022). “Causal Inference for the Brave and True”, 10. Matching, from https://matheusfacure.github.io/python-causality-handbook/10-Matching.html